Week 8 - Testing Plethysmograph circuit

Saturday, 29 September 2012

As salam..

This post is continued from the previous post.
The research on the Plethysmograph is helped
for me to test the circuit that shown in the schematic
below:
pulse plethysmograph circuit
Pulse Plethysmograph Amplifier Circuit


Sensor
The sensor consists of a light source and photodetector.
Whereby the light is shone through the tissues and 
variation in blood volume alters the amount of light falling 
on the detector. The light source and detector can be 
mounted side by side to look at changes in reflected light 
or on either side of a finger or earlobe to detect changed 
in transmitted light. The infrared filter of the phototransistor 
reduces interference from fluorescent lights, which have a 
large AC component in their output.

Amplifier
The amplifier uses an LM358 dual op-amp to provide two 
identical broadly-tuned band pass stages with gains of 100.
The circuit runs from a single 6V battery and the output 
zero is offset by about 1V by referring everything to an 
internal common line at a voltage set by a pair of 
forward-biased silicon diodes. This is convenient for 
interfaces with a 0-5V input.

Components are not critical but the two 2.2uF capacitors 
must be able to stand some reverse bias so they should be 
non-polarized. To get the expected result, the potentiometer 
is adjusted, so that the output is about 2V peak. The trace 
should look like this:
calculating heart rate experiment results
Heart rate trace

calculating heart rate results
Pulse Plethysmograph results during deep breathing
Actually this experiment's result is achieved by using the 
PicoLog software. From this software the expectation 
waveform will display clearly as required. 

So, I'm just trying the circuit by using the oscilloscope 
in lab. The sensor I changed to LDR and Red LED.
The result I obtained is shown as the pictures below:

When the sensor not touched
When the sensor is touched
The first waveform is produced is quite same with
the expected result just had the noise.
The problem I had is, when I'm connected to 
ground, the waveform is not displayed at above.
It was displayed like too much of noise and 
no pattern of waveform can be seen. When I'm 
not connected the ground the result is displayed 
at above.

The potentiometer I'm already adjusted but the 
waveform is still not give any pattern if I'm 
connected to the ground. If I'm disconnected the 
ground the waveform is displayed. 

The sensor I'm already change to the 
IR transmitter and receiver. But the result still the 
same.
The circuit was constructed

Week 7 - Research on the Plethysmograph

Friday, 14 September 2012

As salam..

As the previous post, I'm still on the research the
circuit. For this week, I'm proceed to do a research
for the next circuit that might be suitable for the
measurement of heart rate and pulse oximeter.

I'm also asked the senior that had an experienced
in a project of pulse oximeter and heart rate. Mostly 
few senior that I met, told me that they are used 
plethysmograph. That was my first time heard that kind
of name. ISo that, I'm doing my research on that 
plethymograph circuit. What I found is :

Plethysmograph is an instrument for measuring changes in
volume within an organ or whole body (usually resulting 
in the amount of blood or air it contains). 
A photoplethysmograph (PPG) is a plethysmograph that 
uses optical techniques. A pulse oximeter measures oxygen 
saturation level (SpO2) and is also a PPG.

It can measure the change in the volume of arterial blood
with each pulse beat. This change in blood volume can be 
detected in peripheral part of the body such as the fingertip
or ear lobe using a technique called photoplethysmography.
The pulse oximeter that detects the signal is called a 
plethysmograph (or 'Pleth' for short).

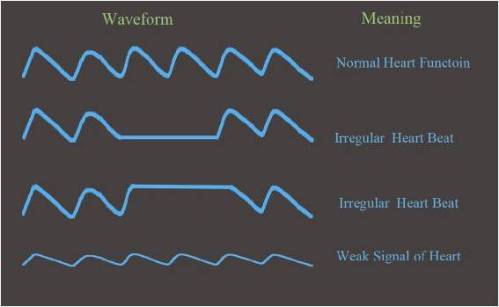
The blood flow is normally shown as a waveform using a 
graph. It can provide useful information regarding the heart 
condition. Below is the different waveform with the status 
of heart beat.


Heart Rhythm
Pleth is useful to detect irregular heart rhythm. The regular
beating or contraction of the heart moves the blood throughout
the body. The heart beating pattern is clearly displayed by 
watching the pleth waveform. This is important to observe the 
pleth waveform because from that the doctor can know 
the condition of the patient's heart.

Signal Strength
Weak signal is indicated by the amplitude of the waveform. 
If the signal is too low, it would affect the accuracy and 
functioning of the pulse oximeter. If your oximeter is not 
giving the correct result, check if the signal strength is too 
low.

There are several causes for the weak signal:
  • Low blood perfusion
  • Dirty sensor or LED lights
  • Improper positioning of the oximeter
All the info I found is help to understand what is actually 
Plethysmograph.. Next post will be about the circuit of
plethysmograph.

(Week5 - Week 6) Research on circuit

Friday, 7 September 2012

As salam..

Since Week4 is the Eid holiday..
I'm continued my research and testing the circuit in
Week5 and Week 6.. :)

As the previous post I had mentioned that my pulse
sensor is already failed in functioning.
This post will focus on the a few circuits that I had
done that is compatible to measure the heart rate
and pulse oximeter. So, I had make some research
about some circuits. Below is the first circuit that I
had tried that used Arduino programme.

Schematic circuit of Pulsometer

The Op-amp that used in this circuit is LM324.
IR led and LDR are used in this circuit.

LM324 is a 14 pin IC consisting of four independent 
operational amplifier (op-amps) compensated in a 
single package. Op-amps are high gain electronic 
voltage amplifier with differential input and a single-ended 
output. The output voltage is many times higher than the 
voltage difference between input terminals of an op-amp.

Theses op-amps are operated by a single power supply 
LM324 and need for a dual supply is eliminated. They 
can be used as amplifiers, comparators, oscillators, 
rectifiers etc. The conventional op-amp applications can 
be more easily implemented with LM324. Here are the
LM324 pin diagram and description. 

LM324
Pin diagram
Pin description

Below is the video that shows successful of the circuit.


As shown, there is working prototype that graphs pulses 
on computer that based on data from serial port. Work 
is going on signal processing to output pulse data, not only 
digital pulsations.

The goal is to build a separate digital/analog sensor for
arduino with possibility  to log data for future reference.

Below is the video of the result that I obtained from 
the schematic circuit that shown in early of this post.


As you can see the graph not stable like the one that
success. When I touched the LDR sensor, it gave the
shape of waveform. When I am not touched it, it became
a flat graph. I had tried to adjust the variable resistor,
but the result still the same.

When I'm looking on the serial monitor, the result in
analog supposedly about 400++ to less than 600.
But the number displayed is fixed to 1000
and that is when I'm not connected to ground.
When I'm connected to ground the reading is going
down to 0.

I'm also tried by change the sensor the LDR to the
IR transmitter and receiver. There is no result is
obtained.

Then, I'm proceed to try other circuit. That one will be
posted for the next post because I'm still in research
for the compatible with measuring heart rate and
pulse oximeter.